Connecte Dness

  • Subscribe to our RSS feed.
  • Twitter
  • StumbleUpon
  • Reddit
  • Facebook
  • Digg

Friday, 10 September 2004

More on the power of visualization

Posted on 11:44 by Unknown
Recently I posted on how different drawings of the same underlying social network can tell very different stories.


For the latest developments on visualizing social networks, see this article in the latest Journal of Social Structure written by Cathleen McGrath (College of Business Administration, Loyola Marymount University) and Jim Blythe (Information Sciences Institute, USC) -- two of the three authors I referenced in my previous post.


Much of the power of social networks analysis comes from the visual impact of seeing an organization drawn as a network. So understanding how observers respond to different visual cues in network layout is crucial to harnessing the power of SNA appropriately.


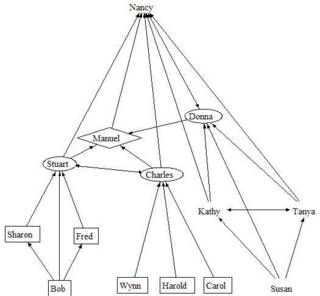
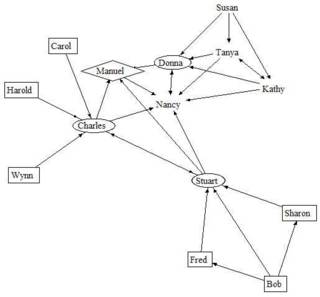
McGrath and Blythe asked graduate students in a business class to evaluate the capacity of two different organizations to change. The students saw two networks that were in fact identical, except for labels and spatial layout. (Here I will show identical labels for simplicity.)


Here are the two "different" organizations:


Some students chose the first organization as more adept at change. A typical justification was


"I think that [the first] group would definitely be more successful in implementing some changes. [This] group has many different authority figures, but there is still one central figure to oversee everything. There is an excellent flow of input in [this] group so that by the time ideas are finalized they should be perfect."


Other students chose the second organization as more adept at change, explaining


"[The second] group because it did not seem as hierarchical. Also, everyone had contact with one another. It seems to me that [this] group would have an easier time because it is more informal. It was not as easy to designate a person to implement change the best for [the hierarchical] group. There needs to be more equality and evenness like [the non-hierarchical] group."


Again, these two organizations are one and the same, just drawn differently.


I am struck that not only does the layout heavily influence perception of the organization, but also some observers are biased to prefer formal hierarchy and others not, when asked the same question (ability to change).


There's lots more in this online paper, including discussion and demonstration of how animated networks display information more powerfully than still-shots of "before" and "after" scenarios. I recommend taking a look even just to watch the animated networks and see the effect yourself.

Email ThisBlogThis!Share to XShare to FacebookShare to Pinterest
Posted in | No comments
Newer Post Older Post Home

0 comments:

Post a Comment

Subscribe to: Post Comments (Atom)

Popular Posts

Blog Archive

  • ►  2012 (1)
    • ►  June (1)
  • ►  2010 (3)
    • ►  June (2)
    • ►  May (1)
  • ►  2009 (22)
    • ►  December (1)
    • ►  September (2)
    • ►  August (2)
    • ►  July (1)
    • ►  June (5)
    • ►  May (4)
    • ►  March (2)
    • ►  February (4)
    • ►  January (1)
  • ►  2008 (36)
    • ►  December (3)
    • ►  November (2)
    • ►  October (1)
    • ►  September (6)
    • ►  August (4)
    • ►  July (2)
    • ►  June (8)
    • ►  May (4)
    • ►  April (3)
    • ►  February (1)
    • ►  January (2)
  • ►  2007 (42)
    • ►  December (1)
    • ►  November (1)
    • ►  October (2)
    • ►  September (6)
    • ►  August (6)
    • ►  July (5)
    • ►  June (8)
    • ►  May (4)
    • ►  March (3)
    • ►  February (1)
    • ►  January (5)
  • ►  2006 (63)
    • ►  December (4)
    • ►  October (2)
    • ►  September (2)
    • ►  August (3)
    • ►  July (7)
    • ►  June (10)
    • ►  May (10)
    • ►  April (4)
    • ►  March (8)
    • ►  February (6)
    • ►  January (7)
  • ►  2005 (136)
    • ►  December (11)
    • ►  November (13)
    • ►  October (11)
    • ►  September (9)
    • ►  August (10)
    • ►  July (10)
    • ►  June (10)
    • ►  May (12)
    • ►  April (13)
    • ►  March (15)
    • ►  February (9)
    • ►  January (13)
  • ▼  2004 (99)
    • ►  December (9)
    • ►  November (18)
    • ►  October (13)
    • ▼  September (16)
      • This week's sign of the apocalypse
      • Customer service really works (at Sears)
      • Another view on personality profiling
      • The Cult of Personality
      • Social Patterns of Innovation
      • LinkedIn
      • Wikipedia
      • Employers and Personality Tests
      • Personality and Propensity to Brokerage
      • Network Entrepreneur Personality Index
      • Job Hunting and Networking
      • More on maximizing influence through a social network
      • More on the power of visualization
      • Guide to cross-cultural community
      • Fall conferences on Social Network Analysis
      • The power of visualizing
    • ►  August (15)
    • ►  July (20)
    • ►  June (8)
Powered by Blogger.

About Me

Unknown
View my complete profile