


Social network analysts aren't the only people interested in finding natural community clusters. Another great application is making sense of all the information on the Internet. I've been talking about that indirectly in this thread on Internet visualization, hoping all the while that some Internet techie would put these pieces together.
Of course, someone did put those pieces together several years ago, and I just found out about it today. I am happy to report that Grokker is here. Here's a nice article about it in a recent issue of the International Herald Tribune, which explains:
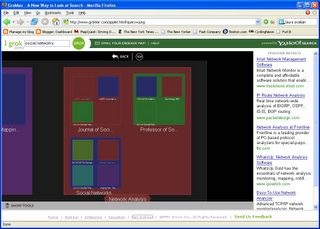
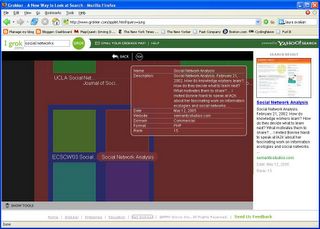
"Groxis, a San Francisco-based company that was founded in 2001, has converted its desktop Grokker software program, which displays a Web search as a series of categories set in a visual map, to run as a Java plug-in for browsers. "On Monday [May 9, 2005] the company will begin allowing computer users to view Yahoo search results with its visualization technology at www.groxis.com. "'We're not intent on replacing Google or Yahoo,' said R.J. Pittman, chief executive of Groxis. 'This is if you want to go deeper.'"
Below I show how Grokker gives me a nine-category breakdown of my query "social networks," including topics like "dynamics," "network analysis," "social capital," and "social software":


0 comments:
Post a Comment